It is becoming more and more important to comprehend what's going on behind the scenes as applications develop into distributed systems made up of microservices, background processes, APIs, and frontend apps. Observability enters the picture at this point. In traditional monolithic applications, debugging often involves adding logs, checking error messages, or attaching a debugger. However, this approach falls short in a distributed environment, where services communicate across processes or networks.
Observability is not just about logs. It’s about having the right data (logs, metrics, traces) and the right tools to connect the dots across your system.
With .NET Aspire, observability is a first-class citizen. Out of the box, Aspire enables.
- Centralized monitoring of all your registered services and apps
- Real-time streaming of logs from all your processes
- Request tracing to follow the path of a request across services
- Visual insights into endpoints, ports, health, and metrics
All of this is surfaced through the Aspire Dashboard, a UI that automatically launches when you run your AppHost project. No extra setup. No complex configurations.
This chapter will guide you through exploring the Aspire Dashboard and making the most of its observability features, starting with understanding the layout and moving on to practical debugging workflows.
The Aspire Dashboard is a powerful, real-time UI that launches automatically when you run your .NET Aspire AppHost project. It provides a unified view of all the services registered in your distributed application — making it your go-to observability cockpit.
If you’ve configured your solution using the .NET Aspire project templates and you're running the AppHost project, the dashboard will open automatically in your default browser.
The dashboard is cleanly divided into tabs, each designed to give insights into different aspects of your application:
- Shows all services registered via AddProject<>, AddContainer<>, etc.
- Lists resource names like api, myweatherapp, etc.
- Displays their current status (Running, Stopped)
- Provides quick actions like:
- Viewing Swagger UI (for APIs)
- Previewing web apps
- Navigating to configured endpoints

- Streams stdout logs from all running services in real-time
- Useful during debugging to view console output, exceptions, or custom log messages
- Supports basic text search and filtering.

3. Structured Tab
- Displays logs in a structured, queryable format
- Helps you drill down into specific log events across services
- Supports rich filters like severity, time range, and resource source

4. Traces Tab
- Shows distributed tracing data (requires OpenTelemetry setup)
- Visualizes the journey of a request across multiple services
- Useful for identifying slowdowns, bottlenecks, and dependencies

5. Metrics Tab
- Tracks key performance metrics like.
- CPU usage
- Memory consumption
- Request counts and durations
- Offers charts and graphs for real-time visibility

The Aspire Dashboard is more than just a service viewer it's your developer control center, letting you,
- See what’s running and healthy
- Follow logs in real-time
- Analyze structured logs and traces
- Monitor performance metrics
The .NET Aspire Dashboard is not just a UI layer it’s a lightweight diagnostic tool built into your distributed application’s lifecycle.

- Hosted as a .NET Worker Service inside your AppHost project.
- It uses gRPC for communication between the dashboard backend and instrumentation clients (your services).
- Relies on the .NET Aspire diagnostics infrastructure to gather:
- Logs
- Metrics
- Distributed traces
- Health data
Here’s a simplified flow of how it works.

The Aspire Dashboard is designed for developer use only in local environments. Here's what you should know.
Access Control
- No authentication or authorization by default
- Exposed on localhost only
- Do NOT expose it in production
Port Binding
- Default port: 18888
- Accessible only on localhost
Security Recommendations
If you need remote access (not recommended in production)
- Use SSH tunneling (e.g., SSH -L 18888:localhost:18888 user@host)
- Consider reverse proxy + auth (e.g., NGINX)
- Use container isolation if running inside the Docker
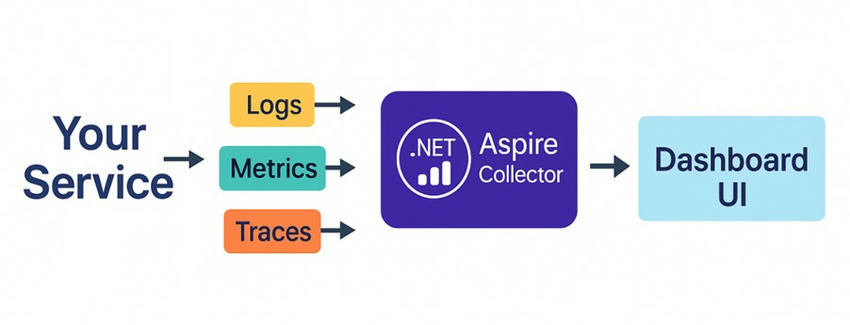
.NET Aspire integrates powerful telemetry capabilities out of the box. Whether you're building APIs, background workers, or full-blown microservices, Aspire automatically enables diagnostics across your services.
When you run your application using the AppHost project, Aspire injects telemetry collectors that gather.
- Logs: Real-time log streams from your services
- Metrics: CPU, memory, request counts, latency, error rates, and more
- Traces: Distributed traces for cross-service calls (HTTP, gRPC, etc.)
- Health Probes: Basic up/down service checks
These diagnostics are funneled to the Aspire Dashboard without any extra configuration.
Internally, .NET Aspire uses OpenTelemetry, an open standard for distributed tracing and metrics collection. Here’s a simplified telemetry flow.
All of this happens via automatic wiring no need to explicitly configure OpenTelemetry unless you want to customize things.
Extending Telemetry
While Aspire gives you a solid default setup, you can extend or override its behavior.
- Add custom loggers like Serilog or Seq
- Export telemetry to external APM tools (like Azure Monitor, Grafana, or Jaeger)
- Define custom metrics for business logic
Sample: Exporting to Console
This uses the OpenTelemetry.Extensions.Hosting package and the standard OpenTelemetry .NET API, both of which are stable and production-ready.
Required NuGet Packages
To use this in your Aspire services, make sure to install it.
Where to Use It?
You can place this snippet in any service project (e.g., your API or Worker service) inside Program.cs.
This setup.
- Exports logs and metrics to the console
- Is useful for debugging and local dev insights
- Complements the Aspire Dashboard’s built-in observability
Use Case: Debugging Performance
Imagine a slow API response. With Aspire telemetry, you can:
- Check the trace tab to see if downstream services caused delays.
- Look at the metrics tab to spot CPU/memory spikes.
- View logs in real-time across all services from the Dashboard console.
Dashboard Themes in .NET Aspire
To enhance the user experience, the Aspire Dashboard includes built-in support for theming. This allows developers to choose how the dashboard appears visually — based on personal preference or development environment conditions.
Available Theme Modes
The Aspire Dashboard currently supports the following three visual themes.
- System Theme (Default)
- This theme adapts automatically to your operating system’s light/dark setting.
- Ideal for users who prefer consistent UI across all their tools and apps.
- Example: If your OS is in dark mode, the dashboard switches to dark too.
- Light Theme
- A clean, high-contrast theme ideal for brightly lit environments.
- Useful when presenting on projectors or during daylight development sessions.
- Offers maximum readability with dark text on light backgrounds.
- Dark Theme
- A developer-favourite theme that reduces eye strain in low-light conditions.
- Complements IDEs and tools that also use dark themes (like VS Code or Rider).
- Reduces screen glare and power usage on OLED displays.
Although seemingly cosmetic, theming can impact productivity and comfort. For long debugging or observability sessions, selecting the right theme can:
- Minimize visual fatigue
- Improve focus on logs, traces, and metrics
- Match your development setup for visual consistency
Theme Selection Experience
You can toggle the theme from the dashboard UI itself.
- Look for the theme selector dropdown (typically in the top-right corner).
- Your selected theme is remembered locally between sessions.
There's no code configuration required theming is fully user-controlled through the dashboard interface.
ASP.NET Core 9.0 Hosting Recommendation
At HostForLIFE.eu, customers can also experience fast ASP.NET Core hosting. The company invested a lot of money to ensure the best and fastest performance of the datacenters, servers, network and other facilities. Its datacenters are equipped with the top equipments like cooling system, fire detection, high speed Internet connection, and so on. That is why HostForLIFEASP.NET guarantees 99.9% uptime for ASP.NET Core. And the engineers do regular maintenance and monitoring works to assure its Orchard hosting are security and always up.


0 comments:
Post a Comment